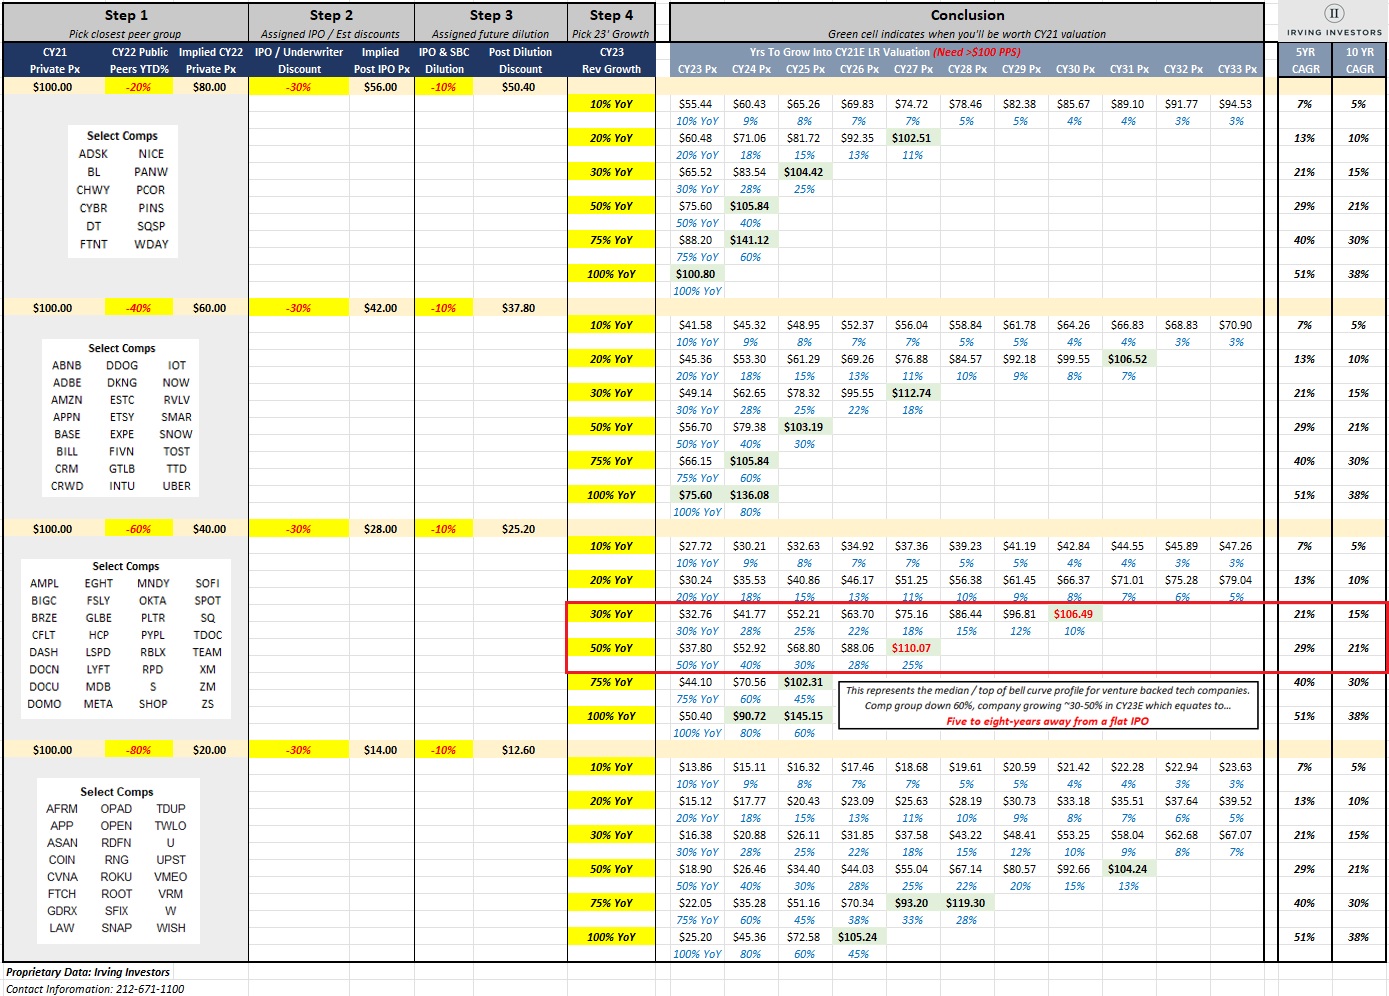
We often hear companies claim: “We will grow into our valuation from 2021.”
That statement is in reference to their expectations of when they’ll price their IPO, or with regards to a future private round. They are implying that they will wait to go public until they can price an IPO higher than or at least at the same valuation as their last funding round. This further implies that the company is opposed to down rounds or publicizing a decrease in their valuation.
Interestingly, these companies claim they can do that — as if growing into one’s 2021 valuation is easy and can happen in the near term.
We always attempt to do the math every time we hear a company make this statement (again, we hear it frequently). In most cases, pricing an IPO at a company’s 2021 valuation is more than a few years away (assuming perfect execution), and in some cases, we don’t think it will ever happen.
Our chart of the quarter depicts the math behind how long it will take companies to price their IPO so they can match their previous valuations:

Image Credits: Irving Investors
Using the chart
If you are growing slower than 30%, there is a strong chance that you will never be able to match your 2021 valuation.
The layout of the chart is meant to give every company the ability to map itself to the grid using a few metrics. The data will then tell you how long it will take a company to achieve the valuation necessary to price an IPO and match their valuation from 2021. The data ranges are generalized, but they are wide enough to be applicable to nearly every company.
Companies need three inputs to use the chart:
- Their own public company comparables group (guidance given below);
- How much that comparable group has sold off this year / CY2022 (guidance given below);
- Projection of your growth rate.
Step 1
- Start with your last round valuation (we mark it at “$100.00”);
- Select the comparable group stock performance discount that is closest to your comparable group’s 2022 sell-off:
